Dashboards
Create Dashboards
Login into Grafana dashboard using credentials supplied during configuration
You will notice that ‘Install Grafana’ & ‘create your first data source’ are already completed. We will import community created dashboard for this tutorial
Click ‘+’ button on left panel and select ‘Import’
Enter 3131 dashboard id under Grafana.com Dashboard & click ‘Load’.
Leave the defaults, select ‘Prometheus’ as the endpoint under prometheus data sources drop down, click ‘Import’.
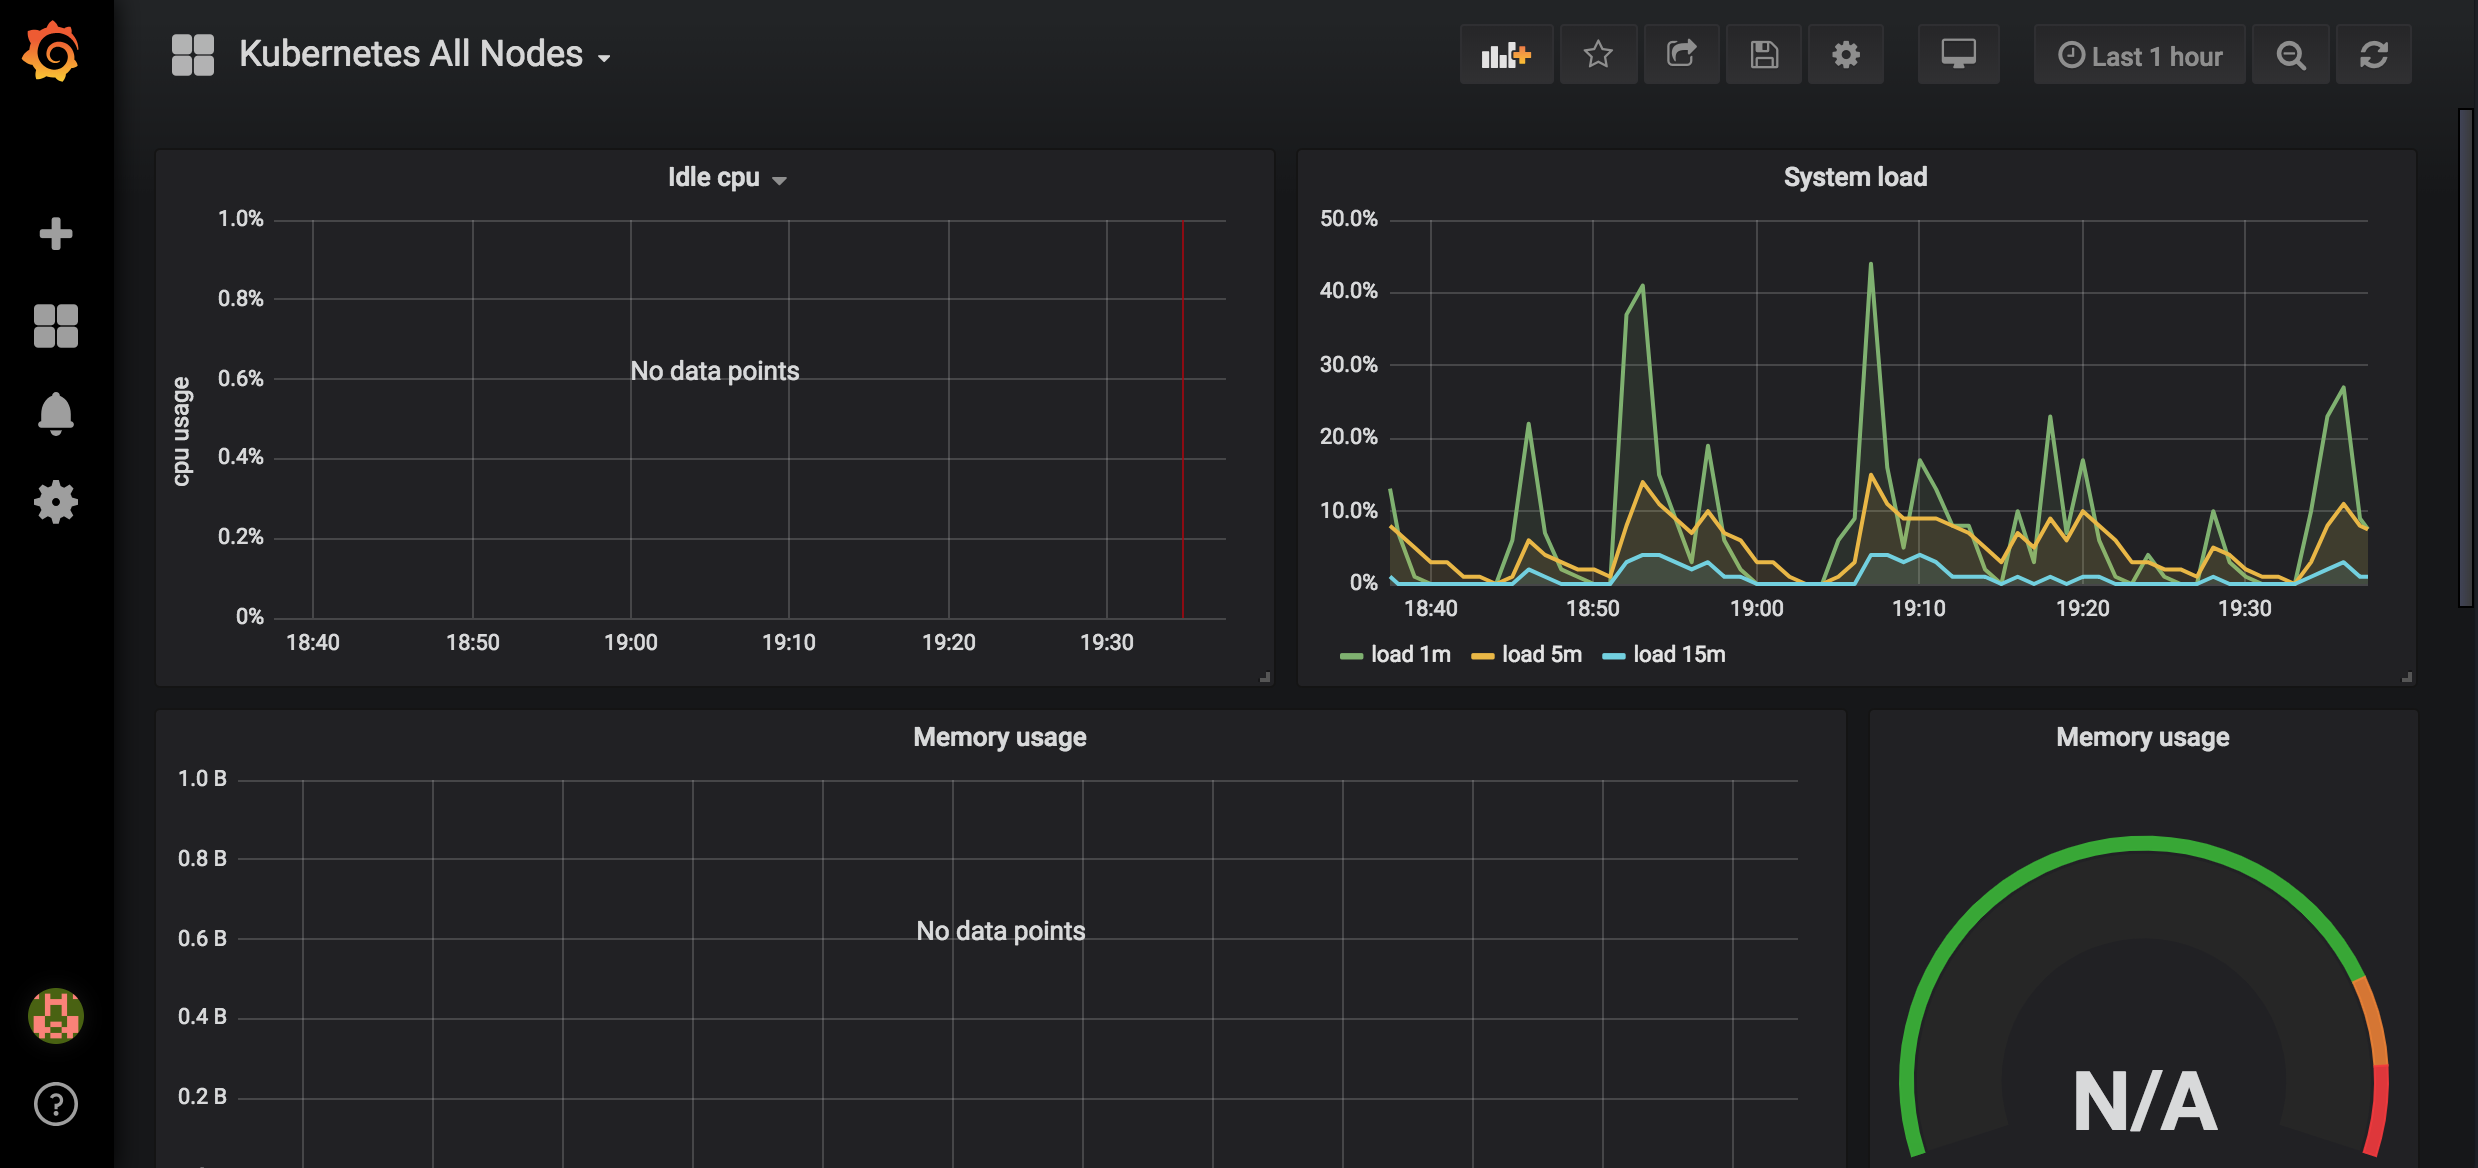
This will show monitoring dashboard for all cluster nodes

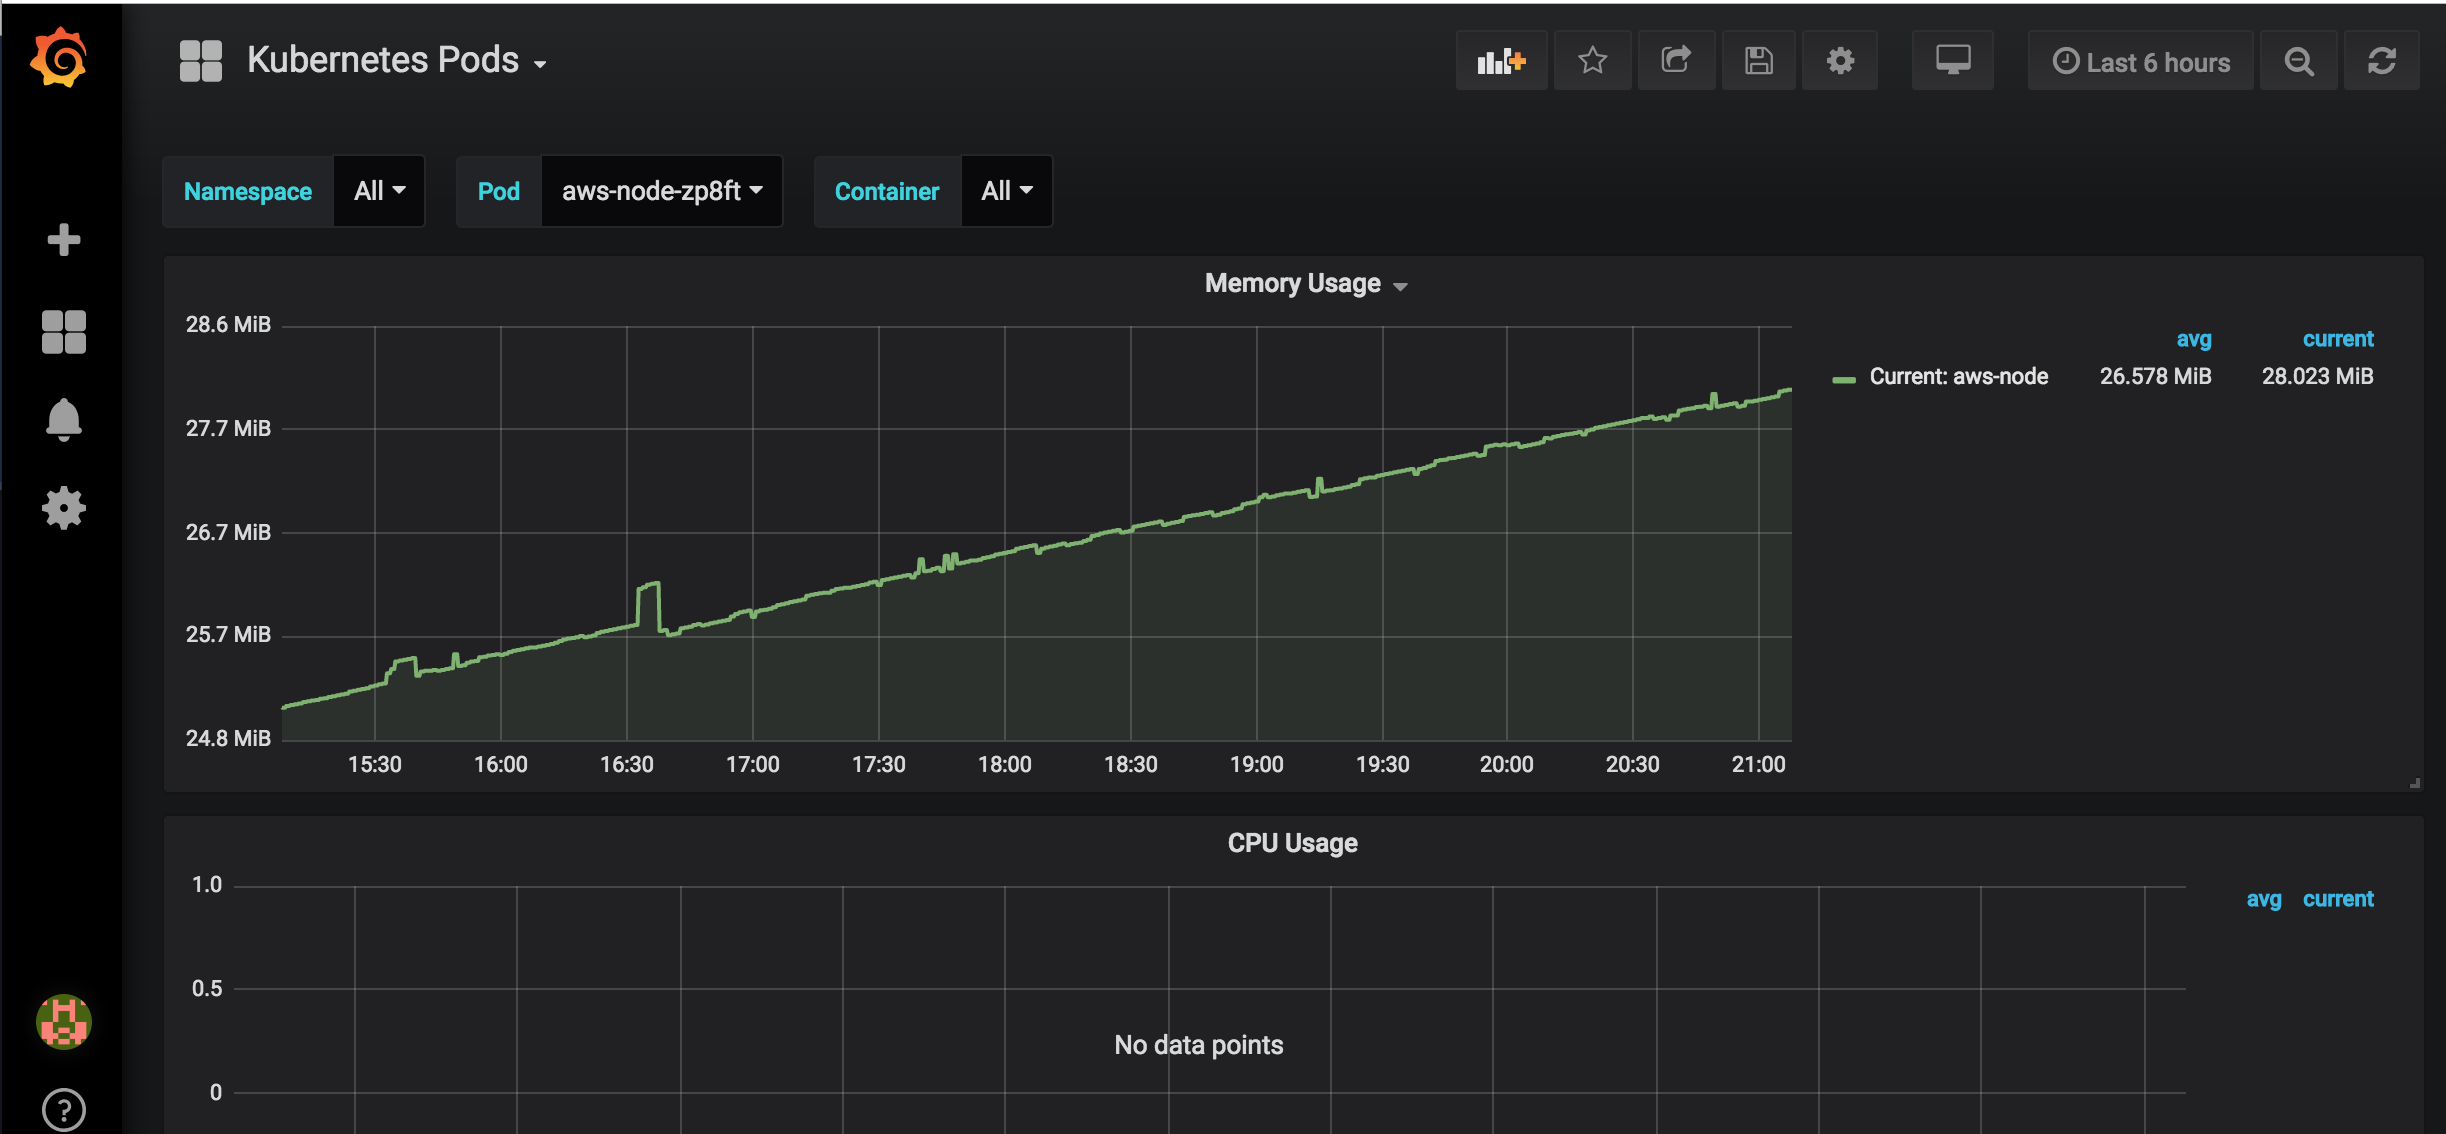
For creating dashboard to monitor all pods, repeat same process as above and enter 3146 for dashboard id
