Deploy Prometheus
Download Prometheus
curl -o prometheus-values.yaml https://raw.githubusercontent.com/helm/charts/master/stable/prometheus/values.yaml
Open the prometheus-values.yaml you downloaded by double clicking on the file name on the left panel. You need to make three edits to this file.
Search for storageClass in the prometheus-values.yaml, uncomment and change the value to “prometheus”. You will do this twice, under both server & alertmanager manifests
The third edit you will do is to expose Prometheus server as a NodePort. Because Prometheus is exposed as ClusterIP by default, the web UI cannot be reached outside of Kubernetes. By exposing the service as NodePort, we will be able to reach Prometheus web UI from the worker node IP address. Search for type: ClusterIP and add nodePort: 30900 and change the type to NodePort as indicated below.
This configuration is not recommended in Production and there are better ways to secure it. You can read more about exposing Prometheus web UI in this link
When you search, you will find there are more than one type: ClusterIP in prometheus-values.yaml. You need to update relevant Prometheus manifest. See below snippet for identifying Prometheus manifest
## List of IP addresses at which the Prometheus server service is available
## Ref: https://kubernetes.io/docs/user-guide/services/#external-ips
##
externalIPs: []

loadBalancerIP: ""
loadBalancerSourceRanges: []
servicePort: 80
nodePort: 30900
type: NodePort
rbac:
  create: true

## Define serviceAccount names for components. Defaults to component's fully qualified name.
##
serviceAccounts:
  alertmanager:
    create: true
    name:
  kubeStateMetrics:
    create: true
    name:
  nodeExporter:
    create: true
    name:
  pushgateway:
    create: true
    name:
  server:
    create: true
    name:

alertmanager:
  ## If false, alertmanager will not be installed
  ##
  enabled: true

  ## alertmanager container name
  ##
  name: alertmanager

  ## alertmanager container image
  ##
  image:
    repository: prom/alertmanager
    tag: v0.15.2
    pullPolicy: IfNotPresent

  ## alertmanager priorityClassName
  ##
  priorityClassName: ""

  ## Additional alertmanager container arguments
  ##
  extraArgs: {}

  ## The URL prefix at which the container can be accessed. Useful in the case the '-web.external-url' includes a slug
  ## so that the various internal URLs are still able to access as they are in the default case.
  ## (Optional)
  prefixURL: ""

  ## External URL which can access alertmanager
  ## Maybe same with Ingress host name
  baseURL: "/"

  ## Additional alertmanager container environment variable
  ## For instance to add a http_proxy
  ##
  extraEnv: {}

  ## ConfigMap override where fullname is {{.Release.Name}}-{{.Values.alertmanager.configMapOverrideName}}
  ## Defining configMapOverrideName will cause templates/alertmanager-configmap.yaml
  ## to NOT generate a ConfigMap resource
  ##
  configMapOverrideName: ""

  ingress:
    ## If true, alertmanager Ingress will be created
    ##
    enabled: false

    ## alertmanager Ingress annotations
    ##
    annotations: {}
    #   kubernetes.io/ingress.class: nginx
    #   kubernetes.io/tls-acme: 'true'

    ## alertmanager Ingress additional labels
    ##
    extraLabels: {}

    ## alertmanager Ingress hostnames with optional path
    ## Must be provided if Ingress is enabled
    ##
    hosts: []
    #   - alertmanager.domain.com
    #   - domain.com/alertmanager

    ## alertmanager Ingress TLS configuration
    ## Secrets must be manually created in the namespace
    ##
    tls: []
    #   - secretName: prometheus-alerts-tls
    #     hosts:
    #       - alertmanager.domain.com

  ## Alertmanager Deployment Strategy type
  # strategy:
  #   type: Recreate

  ## Node tolerations for alertmanager scheduling to nodes with taints
  ## Ref: https://kubernetes.io/docs/concepts/configuration/assign-pod-node/
  ##
  tolerations: []
    # - key: "key"
    #   operator: "Equal|Exists"
    #   value: "value"
    #   effect: "NoSchedule|PreferNoSchedule|NoExecute(1.6 only)"

  ## Node labels for alertmanager pod assignment
  ## Ref: https://kubernetes.io/docs/user-guide/node-selection/
  ##
  nodeSelector: {}

  ## Pod affinity
  ##
  affinity: {}

  ## Use an alternate scheduler, e.g. "stork".
  ## ref: https://kubernetes.io/docs/tasks/administer-cluster/configure-multiple-schedulers/
  ##
  # schedulerName:

  persistentVolume:
    ## If true, alertmanager will create/use a Persistent Volume Claim
    ## If false, use emptyDir
    ##
    enabled: true

    ## alertmanager data Persistent Volume access modes
    ## Must match those of existing PV or dynamic provisioner
    ## Ref: http://kubernetes.io/docs/user-guide/persistent-volumes/
    ##
    accessModes:
      - ReadWriteOnce

    ## alertmanager data Persistent Volume Claim annotations
    ##
    annotations: {}

    ## alertmanager data Persistent Volume existing claim name
    ## Requires alertmanager.persistentVolume.enabled: true
    ## If defined, PVC must be created manually before volume will be bound
    existingClaim: ""

    ## alertmanager data Persistent Volume mount root path
    ##
    mountPath: /data

    ## alertmanager data Persistent Volume size
    ##
    size: 2Gi

    ## alertmanager data Persistent Volume Storage Class
    ## If defined, storageClassName: <storageClass>
    ## If set to "-", storageClassName: "", which disables dynamic provisioning
    ## If undefined (the default) or set to null, no storageClassName spec is
    ##   set, choosing the default provisioner.  (gp2 on AWS, standard on
    ##   GKE, AWS & OpenStack)
    ##
    storageClass: "prometheus"

    ## Subdirectory of alertmanager data Persistent Volume to mount
    ## Useful if the volume's root directory is not empty
    ##
    subPath: ""

  ## Annotations to be added to alertmanager pods
  ##
  podAnnotations: {}

  replicaCount: 1

  ## alertmanager resource requests and limits
  ## Ref: http://kubernetes.io/docs/user-guide/compute-resources/
  ##
  resources: {}
    # limits:
    #   cpu: 10m
    #   memory: 32Mi
    # requests:
    #   cpu: 10m
    #   memory: 32Mi

  ## Security context to be added to alertmanager pods
  ##
  securityContext: {}

  service:
    annotations: {}
    labels: {}
    clusterIP: ""

    ## Enabling peer mesh service end points for enabling the HA alert manager
    ## Ref: https://github.com/prometheus/alertmanager/blob/master/README.md
    # enableMeshPeer : true

    ## List of IP addresses at which the alertmanager service is available
    ## Ref: https://kubernetes.io/docs/user-guide/services/#external-ips
    ##
    externalIPs: []

    loadBalancerIP: ""
    loadBalancerSourceRanges: []
    servicePort: 80
    # nodePort: 30000
    type: ClusterIP

## Monitors ConfigMap changes and POSTs to a URL
## Ref: https://github.com/jimmidyson/configmap-reload
##
configmapReload:
  ## configmap-reload container name
  ##
  name: configmap-reload

  ## configmap-reload container image
  ##
  image:
    repository: jimmidyson/configmap-reload
    tag: v0.2.2
    pullPolicy: IfNotPresent

  ## Additional configmap-reload container arguments
  ##
  extraArgs: {}

  ## Additional configmap-reload mounts
  ##
  extraConfigmapMounts: []
    # - name: prometheus-alerts
    #   mountPath: /etc/alerts.d
    #   subPath: ""
    #   configMap: prometheus-alerts
    #   readOnly: true


  ## configmap-reload resource requests and limits
  ## Ref: http://kubernetes.io/docs/user-guide/compute-resources/
  ##
  resources: {}

initChownData:
  ## If false, data ownership will not be reset at startup
  ## This allows the prometheus-server to be run with an arbitrary user
  ##
  enabled: true

  ## initChownData container name
  ##
  name: init-chown-data

  ## initChownData container image
  ##
  image:
    repository: busybox
    tag: latest
    pullPolicy: IfNotPresent

  ## initChownData resource requests and limits
  ## Ref: http://kubernetes.io/docs/user-guide/compute-resources/
  ##
  resources: {}

kubeStateMetrics:
  ## If false, kube-state-metrics will not be installed
  ##
  enabled: true

  ## kube-state-metrics container name
  ##
  name: kube-state-metrics

  ## kube-state-metrics container image
  ##
  image:
    repository: quay.io/coreos/kube-state-metrics
    tag: v1.4.0
    pullPolicy: IfNotPresent

  ## kube-state-metrics priorityClassName
  ##
  priorityClassName: ""

  ## kube-state-metrics container arguments
  ##
  args: {}

  ## Node tolerations for kube-state-metrics scheduling to nodes with taints
  ## Ref: https://kubernetes.io/docs/concepts/configuration/assign-pod-node/
  ##
  tolerations: []
    # - key: "key"
    #   operator: "Equal|Exists"
    #   value: "value"
    #   effect: "NoSchedule|PreferNoSchedule|NoExecute(1.6 only)"

  ## Node labels for kube-state-metrics pod assignment
  ## Ref: https://kubernetes.io/docs/user-guide/node-selection/
  ##
  nodeSelector: {}

  ## Annotations to be added to kube-state-metrics pods
  ##
  podAnnotations: {}

  pod:
    labels: {}

  replicaCount: 1

  ## kube-state-metrics resource requests and limits
  ## Ref: http://kubernetes.io/docs/user-guide/compute-resources/
  ##
  resources: {}
    # limits:
    #   cpu: 10m
    #   memory: 16Mi
    # requests:
    #   cpu: 10m
    #   memory: 16Mi

  ## Security context to be added to kube-state-metrics pods
  ##
  securityContext: {}

  service:
    annotations:
      prometheus.io/scrape: "true"
    labels: {}

    # Exposed as a headless service:
    # https://kubernetes.io/docs/concepts/services-networking/service/#headless-services
    clusterIP: None

    ## List of IP addresses at which the kube-state-metrics service is available
    ## Ref: https://kubernetes.io/docs/user-guide/services/#external-ips
    ##
    externalIPs: []

    loadBalancerIP: ""
    loadBalancerSourceRanges: []
    servicePort: 80
    type: ClusterIP

nodeExporter:
  ## If false, node-exporter will not be installed
  ##
  enabled: true

  ## If true, node-exporter pods share the host network namespace
  ##
  hostNetwork: true

  ## If true, node-exporter pods share the host PID namespace
  ##
  hostPID: true

  ## node-exporter container name
  ##
  name: node-exporter

  ## node-exporter container image
  ##
  image:
    repository: prom/node-exporter
    tag: v0.16.0
    pullPolicy: IfNotPresent

  ## Specify if a Pod Security Policy for node-exporter must be created
  ## Ref: https://kubernetes.io/docs/concepts/policy/pod-security-policy/
  ##
  podSecurityPolicy:
    enabled: False

  ## node-exporter priorityClassName
  ##
  priorityClassName: ""

  ## Custom Update Strategy
  ##
  updateStrategy:
    type: OnDelete

  ## Additional node-exporter container arguments
  ##
  extraArgs: {}

  ## Additional node-exporter hostPath mounts
  ##
  extraHostPathMounts: []
    # - name: textfile-dir
    #   mountPath: /srv/txt_collector
    #   hostPath: /var/lib/node-exporter
    #   readOnly: true

  extraConfigmapMounts: []
    # - name: certs-configmap
    #   mountPath: /prometheus
    #   configMap: certs-configmap
    #   readOnly: true

  ## Node tolerations for node-exporter scheduling to nodes with taints
  ## Ref: https://kubernetes.io/docs/concepts/configuration/assign-pod-node/
  ##
  tolerations: []
    # - key: "key"
    #   operator: "Equal|Exists"
    #   value: "value"
    #   effect: "NoSchedule|PreferNoSchedule|NoExecute(1.6 only)"

  ## Node labels for node-exporter pod assignment
  ## Ref: https://kubernetes.io/docs/user-guide/node-selection/
  ##
  nodeSelector: {}

  ## Annotations to be added to node-exporter pods
  ##
  podAnnotations: {}

  ## Labels to be added to node-exporter pods
  ##
  pod:
    labels: {}

  ## node-exporter resource limits & requests
  ## Ref: https://kubernetes.io/docs/user-guide/compute-resources/
  ##
  resources: {}
    # limits:
    #   cpu: 200m
    #   memory: 50Mi
    # requests:
    #   cpu: 100m
    #   memory: 30Mi

  ## Security context to be added to node-exporter pods
  ##
  securityContext: {}
    # runAsUser: 0

  service:
    annotations:
      prometheus.io/scrape: "true"
    labels: {}

    # Exposed as a headless service:
    # https://kubernetes.io/docs/concepts/services-networking/service/#headless-services
    clusterIP: None

    ## List of IP addresses at which the node-exporter service is available
    ## Ref: https://kubernetes.io/docs/user-guide/services/#external-ips
    ##
    externalIPs: []

    hostPort: 9100
    loadBalancerIP: ""
    loadBalancerSourceRanges: []
    servicePort: 9100
    type: ClusterIP

server:
  ## Prometheus server container name
  ##
  name: server

  ## Prometheus server container image
  ##
  image:
    repository: prom/prometheus
    tag: v2.4.3
    pullPolicy: IfNotPresent

  ## prometheus server priorityClassName
  ##
  priorityClassName: ""

  ## The URL prefix at which the container can be accessed. Useful in the case the '-web.external-url' includes a slug
  ## so that the various internal URLs are still able to access as they are in the default case.
  ## (Optional)
  prefixURL: ""

  ## External URL which can access alertmanager
  ## Maybe same with Ingress host name
  baseURL: ""

  ## This flag controls access to the administrative HTTP API which includes functionality such as deleting time
  ## series. This is disabled by default.
  enableAdminApi: false

  global:
    ## How frequently to scrape targets by default
    ##
    scrape_interval: 1m
    ## How long until a scrape request times out
    ##
    scrape_timeout: 10s
    ## How frequently to evaluate rules
    ##
    evaluation_interval: 1m

  ## Additional Prometheus server container arguments
  ##
  extraArgs: {}

  ## Additional Prometheus server hostPath mounts
  ##
  extraHostPathMounts: []
    # - name: certs-dir
    #   mountPath: /etc/kubernetes/certs
    #   subPath: ""
    #   hostPath: /etc/kubernetes/certs
    #   readOnly: true

  extraConfigmapMounts: []
    # - name: certs-configmap
    #   mountPath: /prometheus
    #   subPath: ""
    #   configMap: certs-configmap
    #   readOnly: true

  ## Additional Prometheus server Secret mounts
  # Defines additional mounts with secrets. Secrets must be manually created in the namespace.
  extraSecretMounts: []
    # - name: secret-files
    #   mountPath: /etc/secrets
    #   subPath: ""
    #   secretName: prom-secret-files
    #   readOnly: true

  ## ConfigMap override where fullname is {{.Release.Name}}-{{.Values.server.configMapOverrideName}}
  ## Defining configMapOverrideName will cause templates/server-configmap.yaml
  ## to NOT generate a ConfigMap resource
  ##
  configMapOverrideName: ""

  ingress:
    ## If true, Prometheus server Ingress will be created
    ##
    enabled: false

    ## Prometheus server Ingress annotations
    ##
    annotations: {}
    #   kubernetes.io/ingress.class: nginx
    #   kubernetes.io/tls-acme: 'true'

    ## Prometheus server Ingress additional labels
    ##
    extraLabels: {}

    ## Prometheus server Ingress hostnames with optional path
    ## Must be provided if Ingress is enabled
    ##
    hosts: []
    #   - prometheus.domain.com
    #   - domain.com/prometheus

    ## Prometheus server Ingress TLS configuration
    ## Secrets must be manually created in the namespace
    ##
    tls: []
    #   - secretName: prometheus-server-tls
    #     hosts:
    #       - prometheus.domain.com

  ## Server Deployment Strategy type
  # strategy:
  #   type: Recreate

  ## Node tolerations for server scheduling to nodes with taints
  ## Ref: https://kubernetes.io/docs/concepts/configuration/assign-pod-node/
  ##
  tolerations: []
    # - key: "key"
    #   operator: "Equal|Exists"
    #   value: "value"
    #   effect: "NoSchedule|PreferNoSchedule|NoExecute(1.6 only)"

  ## Node labels for Prometheus server pod assignment
  ## Ref: https://kubernetes.io/docs/user-guide/node-selection/
  ##
  nodeSelector: {}

  ## Pod affinity
  ##
  affinity: {}

  ## Use an alternate scheduler, e.g. "stork".
  ## ref: https://kubernetes.io/docs/tasks/administer-cluster/configure-multiple-schedulers/
  ##
  # schedulerName:

  persistentVolume:
    ## If true, Prometheus server will create/use a Persistent Volume Claim
    ## If false, use emptyDir
    ##
    enabled: true

    ## Prometheus server data Persistent Volume access modes
    ## Must match those of existing PV or dynamic provisioner
    ## Ref: http://kubernetes.io/docs/user-guide/persistent-volumes/
    ##
    accessModes:
      - ReadWriteOnce

    ## Prometheus server data Persistent Volume annotations
    ##
    annotations: {}

    ## Prometheus server data Persistent Volume existing claim name
    ## Requires server.persistentVolume.enabled: true
    ## If defined, PVC must be created manually before volume will be bound
    existingClaim: ""

    ## Prometheus server data Persistent Volume mount root path
    ##
    mountPath: /data

    ## Prometheus server data Persistent Volume size
    ##
    size: 8Gi

    ## Prometheus server data Persistent Volume Storage Class
    ## If defined, storageClassName: <storageClass>
    ## If set to "-", storageClassName: "", which disables dynamic provisioning
    ## If undefined (the default) or set to null, no storageClassName spec is
    ##   set, choosing the default provisioner.  (gp2 on AWS, standard on
    ##   GKE, AWS & OpenStack)
    ##
    storageClass: "prometheus"

    ## Subdirectory of Prometheus server data Persistent Volume to mount
    ## Useful if the volume's root directory is not empty
    ##
    subPath: ""

  ## Annotations to be added to Prometheus server pods
  ##
  podAnnotations: {}
    # iam.amazonaws.com/role: prometheus

  replicaCount: 1

  ## Prometheus server resource requests and limits
  ## Ref: http://kubernetes.io/docs/user-guide/compute-resources/
  ##
  resources: {}
    # limits:
    #   cpu: 500m
    #   memory: 512Mi
    # requests:
    #   cpu: 500m
    #   memory: 512Mi

  ## Security context to be added to server pods
  ##
  securityContext: {}

  service:
    annotations: {}
    labels: {}
    clusterIP: ""

    ## List of IP addresses at which the Prometheus server service is available
    ## Ref: https://kubernetes.io/docs/user-guide/services/#external-ips
    ##
    externalIPs: [54.210.142.247]

    loadBalancerIP: ""
    loadBalancerSourceRanges: []
    servicePort: 80
    nodePort: 30900
    type: NodePort

  ## Prometheus server pod termination grace period
  ##
  terminationGracePeriodSeconds: 300

  ## Prometheus data retention period (i.e 360h)
  ##
  retention: ""

pushgateway:
  ## If false, pushgateway will not be installed
  ##
  enabled: true

  ## pushgateway container name
  ##
  name: pushgateway

  ## pushgateway container image
  ##
  image:
    repository: prom/pushgateway
    tag: v0.5.2
    pullPolicy: IfNotPresent

  ## pushgateway priorityClassName
  ##
  priorityClassName: ""

  ## Additional pushgateway container arguments
  ##
  extraArgs: {}

  ingress:
    ## If true, pushgateway Ingress will be created
    ##
    enabled: false

    ## pushgateway Ingress annotations
    ##
    annotations: {}
    #   kubernetes.io/ingress.class: nginx
    #   kubernetes.io/tls-acme: 'true'

    ## pushgateway Ingress hostnames with optional path
    ## Must be provided if Ingress is enabled
    ##
    hosts: []
    #   - pushgateway.domain.com
    #   - domain.com/pushgateway

    ## pushgateway Ingress TLS configuration
    ## Secrets must be manually created in the namespace
    ##
    tls: []
    #   - secretName: prometheus-alerts-tls
    #     hosts:
    #       - pushgateway.domain.com

  ## Node tolerations for pushgateway scheduling to nodes with taints
  ## Ref: https://kubernetes.io/docs/concepts/configuration/assign-pod-node/
  ##
  tolerations: []
    # - key: "key"
    #   operator: "Equal|Exists"
    #   value: "value"
    #   effect: "NoSchedule|PreferNoSchedule|NoExecute(1.6 only)"

  ## Node labels for pushgateway pod assignment
  ## Ref: https://kubernetes.io/docs/user-guide/node-selection/
  ##
  nodeSelector: {}

  ## Annotations to be added to pushgateway pods
  ##
  podAnnotations: {}

  replicaCount: 1

  ## pushgateway resource requests and limits
  ## Ref: http://kubernetes.io/docs/user-guide/compute-resources/
  ##
  resources: {}
    # limits:
    #   cpu: 10m
    #   memory: 32Mi
    # requests:
    #   cpu: 10m
    #   memory: 32Mi

  ## Security context to be added to push-gateway pods
  ##
  securityContext: {}

  service:
    annotations:
      prometheus.io/probe: pushgateway
    labels: {}
    clusterIP: ""

    ## List of IP addresses at which the pushgateway service is available
    ## Ref: https://kubernetes.io/docs/user-guide/services/#external-ips
    ##
    externalIPs: []

    loadBalancerIP: ""
    loadBalancerSourceRanges: []
    servicePort: 9091
    type: ClusterIP

## alertmanager ConfigMap entries
##
alertmanagerFiles:
  alertmanager.yml:
    global: {}
      # slack_api_url: ''

    receivers:
      - name: default-receiver
        # slack_configs:
        #  - channel: '@you'
        #    send_resolved: true

    route:
      group_wait: 10s
      group_interval: 5m
      receiver: default-receiver
      repeat_interval: 3h

## Prometheus server ConfigMap entries
##
serverFiles:
  alerts: {}
  rules: {}

  prometheus.yml:
    rule_files:
      - /etc/config/rules
      - /etc/config/alerts

    scrape_configs:
      - job_name: prometheus
        static_configs:
          - targets:
            - localhost:9090

      # A scrape configuration for running Prometheus on a Kubernetes cluster.
      # This uses separate scrape configs for cluster components (i.e. API server, node)
      # and services to allow each to use different authentication configs.
      #
      # Kubernetes labels will be added as Prometheus labels on metrics via the
      # `labelmap` relabeling action.

      # Scrape config for API servers.
      #
      # Kubernetes exposes API servers as endpoints to the default/kubernetes
      # service so this uses `endpoints` role and uses relabelling to only keep
      # the endpoints associated with the default/kubernetes service using the
      # default named port `https`. This works for single API server deployments as
      # well as HA API server deployments.
      - job_name: 'kubernetes-apiservers'

        kubernetes_sd_configs:
          - role: endpoints

        # Default to scraping over https. If required, just disable this or change to
        # `http`.
        scheme: https

        # This TLS & bearer token file config is used to connect to the actual scrape
        # endpoints for cluster components. This is separate to discovery auth
        # configuration because discovery & scraping are two separate concerns in
        # Prometheus. The discovery auth config is automatic if Prometheus runs inside
        # the cluster. Otherwise, more config options have to be provided within the
        # <kubernetes_sd_config>.
        tls_config:
          ca_file: /var/run/secrets/kubernetes.io/serviceaccount/ca.crt
          # If your node certificates are self-signed or use a different CA to the
          # master CA, then disable certificate verification below. Note that
          # certificate verification is an integral part of a secure infrastructure
          # so this should only be disabled in a controlled environment. You can
          # disable certificate verification by uncommenting the line below.
          #
          insecure_skip_verify: true
        bearer_token_file: /var/run/secrets/kubernetes.io/serviceaccount/token

        # Keep only the default/kubernetes service endpoints for the https port. This
        # will add targets for each API server which Kubernetes adds an endpoint to
        # the default/kubernetes service.
        relabel_configs:
          - source_labels: [__meta_kubernetes_namespace, __meta_kubernetes_service_name, __meta_kubernetes_endpoint_port_name]
            action: keep
            regex: default;kubernetes;https

      - job_name: 'kubernetes-nodes'

        # Default to scraping over https. If required, just disable this or change to
        # `http`.
        scheme: https

        # This TLS & bearer token file config is used to connect to the actual scrape
        # endpoints for cluster components. This is separate to discovery auth
        # configuration because discovery & scraping are two separate concerns in
        # Prometheus. The discovery auth config is automatic if Prometheus runs inside
        # the cluster. Otherwise, more config options have to be provided within the
        # <kubernetes_sd_config>.
        tls_config:
          ca_file: /var/run/secrets/kubernetes.io/serviceaccount/ca.crt
          # If your node certificates are self-signed or use a different CA to the
          # master CA, then disable certificate verification below. Note that
          # certificate verification is an integral part of a secure infrastructure
          # so this should only be disabled in a controlled environment. You can
          # disable certificate verification by uncommenting the line below.
          #
          insecure_skip_verify: true
        bearer_token_file: /var/run/secrets/kubernetes.io/serviceaccount/token

        kubernetes_sd_configs:
          - role: node

        relabel_configs:
          - action: labelmap
            regex: __meta_kubernetes_node_label_(.+)
          - target_label: __address__
            replacement: kubernetes.default.svc:443
          - source_labels: [__meta_kubernetes_node_name]
            regex: (.+)
            target_label: __metrics_path__
            replacement: /api/v1/nodes/${1}/proxy/metrics


      - job_name: 'kubernetes-nodes-cadvisor'

        # Default to scraping over https. If required, just disable this or change to
        # `http`.
        scheme: https

        # This TLS & bearer token file config is used to connect to the actual scrape
        # endpoints for cluster components. This is separate to discovery auth
        # configuration because discovery & scraping are two separate concerns in
        # Prometheus. The discovery auth config is automatic if Prometheus runs inside
        # the cluster. Otherwise, more config options have to be provided within the
        # <kubernetes_sd_config>.
        tls_config:
          ca_file: /var/run/secrets/kubernetes.io/serviceaccount/ca.crt
          # If your node certificates are self-signed or use a different CA to the
          # master CA, then disable certificate verification below. Note that
          # certificate verification is an integral part of a secure infrastructure
          # so this should only be disabled in a controlled environment. You can
          # disable certificate verification by uncommenting the line below.
          #
          insecure_skip_verify: true
        bearer_token_file: /var/run/secrets/kubernetes.io/serviceaccount/token

        kubernetes_sd_configs:
          - role: node

        # This configuration will work only on kubelet 1.7.3+
        # As the scrape endpoints for cAdvisor have changed
        # if you are using older version you need to change the replacement to
        # replacement: /api/v1/nodes/${1}:4194/proxy/metrics
        # more info here https://github.com/coreos/prometheus-operator/issues/633
        relabel_configs:
          - action: labelmap
            regex: __meta_kubernetes_node_label_(.+)
          - target_label: __address__
            replacement: kubernetes.default.svc:443
          - source_labels: [__meta_kubernetes_node_name]
            regex: (.+)
            target_label: __metrics_path__
            replacement: /api/v1/nodes/${1}/proxy/metrics/cadvisor

      # Scrape config for service endpoints.
      #
      # The relabeling allows the actual service scrape endpoint to be configured
      # via the following annotations:
      #
      # * `prometheus.io/scrape`: Only scrape services that have a value of `true`
      # * `prometheus.io/scheme`: If the metrics endpoint is secured then you will need
      # to set this to `https` & most likely set the `tls_config` of the scrape config.
      # * `prometheus.io/path`: If the metrics path is not `/metrics` override this.
      # * `prometheus.io/port`: If the metrics are exposed on a different port to the
      # service then set this appropriately.
      - job_name: 'kubernetes-service-endpoints'

        kubernetes_sd_configs:
          - role: endpoints

        relabel_configs:
          - source_labels: [__meta_kubernetes_service_annotation_prometheus_io_scrape]
            action: keep
            regex: true
          - source_labels: [__meta_kubernetes_service_annotation_prometheus_io_scheme]
            action: replace
            target_label: __scheme__
            regex: (https?)
          - source_labels: [__meta_kubernetes_service_annotation_prometheus_io_path]
            action: replace
            target_label: __metrics_path__
            regex: (.+)
          - source_labels: [__address__, __meta_kubernetes_service_annotation_prometheus_io_port]
            action: replace
            target_label: __address__
            regex: ([^:]+)(?::\d+)?;(\d+)
            replacement: $1:$2
          - action: labelmap
            regex: __meta_kubernetes_service_label_(.+)
          - source_labels: [__meta_kubernetes_namespace]
            action: replace
            target_label: kubernetes_namespace
          - source_labels: [__meta_kubernetes_service_name]
            action: replace
            target_label: kubernetes_name

      - job_name: 'prometheus-pushgateway'
        honor_labels: true

        kubernetes_sd_configs:
          - role: service

        relabel_configs:
          - source_labels: [__meta_kubernetes_service_annotation_prometheus_io_probe]
            action: keep
            regex: pushgateway

      # Example scrape config for probing services via the Blackbox Exporter.
      #
      # The relabeling allows the actual service scrape endpoint to be configured
      # via the following annotations:
      #
      # * `prometheus.io/probe`: Only probe services that have a value of `true`
      - job_name: 'kubernetes-services'

        metrics_path: /probe
        params:
          module: [http_2xx]

        kubernetes_sd_configs:
          - role: service

        relabel_configs:
          - source_labels: [__meta_kubernetes_service_annotation_prometheus_io_probe]
            action: keep
            regex: true
          - source_labels: [__address__]
            target_label: __param_target
          - target_label: __address__
            replacement: blackbox
          - source_labels: [__param_target]
            target_label: instance
          - action: labelmap
            regex: __meta_kubernetes_service_label_(.+)
          - source_labels: [__meta_kubernetes_namespace]
            target_label: kubernetes_namespace
          - source_labels: [__meta_kubernetes_service_name]
            target_label: kubernetes_name

      # Example scrape config for pods
      #
      # The relabeling allows the actual pod scrape endpoint to be configured via the
      # following annotations:
      #
      # * `prometheus.io/scrape`: Only scrape pods that have a value of `true`
      # * `prometheus.io/path`: If the metrics path is not `/metrics` override this.
      # * `prometheus.io/port`: Scrape the pod on the indicated port instead of the default of `9102`.
      - job_name: 'kubernetes-pods'

        kubernetes_sd_configs:
          - role: pod

        relabel_configs:
          - source_labels: [__meta_kubernetes_pod_annotation_prometheus_io_scrape]
            action: keep
            regex: true
          - source_labels: [__meta_kubernetes_pod_annotation_prometheus_io_path]
            action: replace
            target_label: __metrics_path__
            regex: (.+)
          - source_labels: [__address__, __meta_kubernetes_pod_annotation_prometheus_io_port]
            action: replace
            regex: ([^:]+)(?::\d+)?;(\d+)
            replacement: $1:$2
            target_label: __address__
          - action: labelmap
            regex: __meta_kubernetes_pod_label_(.+)
          - source_labels: [__meta_kubernetes_namespace]
            action: replace
            target_label: kubernetes_namespace
          - source_labels: [__meta_kubernetes_pod_name]
            action: replace
            target_label: kubernetes_pod_name

# adds additional scrape configs to prometheus.yml
# must be a string so you have to add a | after extraScrapeConfigs:
# example adds prometheus-blackbox-exporter scrape config
extraScrapeConfigs:
  # - job_name: 'prometheus-blackbox-exporter'
  #   metrics_path: /probe
  #   params:
  #     module: [http_2xx]
  #   static_configs:
  #     - targets:
  #       - https://example.com
  #   relabel_configs:
  #     - source_labels: [__address__]
  #       target_label: __param_target
  #     - source_labels: [__param_target]
  #       target_label: instance
  #     - target_label: __address__
  #       replacement: prometheus-blackbox-exporter:9115

networkPolicy:
  ## Enable creation of NetworkPolicy resources.
  ##
  enabled: false
Deploy Prometheus
helm install -f prometheus-values.yaml stable/prometheus --name prometheus --namespace prometheus
Make a note of prometheus endpoint in helm response (you will need this later). It should look similar to below
The Prometheus server can be accessed via port 80 on the following DNS name from within your cluster:
prometheus-server.prometheus.svc.cluster.local
Check if Prometheus components deployed as expected
kubectl get all -n prometheus
You should see response similar to below. They should all be Ready and Available
NAME                                                 READY     STATUS    RESTARTS   AGE
pod/prometheus-alertmanager-77cfdf85db-s9p48         2/2       Running   0          1m
pod/prometheus-kube-state-metrics-74d5c694c7-vqtjd   1/1       Running   0          1m
pod/prometheus-node-exporter-6dhpw                   1/1       Running   0          1m
pod/prometheus-node-exporter-nrfkn                   1/1       Running   0          1m
pod/prometheus-node-exporter-rtrm8                   1/1       Running   0          1m
pod/prometheus-pushgateway-d5fdc4f5b-dbmrg           1/1       Running   0          1m
pod/prometheus-server-6d665b876-dsmh9                2/2       Running   0          1m

NAME                                    TYPE        CLUSTER-IP       EXTERNAL-IP   PORT(S)    AGE
service/prometheus-alertmanager         ClusterIP   10.100.89.154    <none>        80/TCP     1m
service/prometheus-kube-state-metrics   ClusterIP   None             <none>        80/TCP     1m
service/prometheus-node-exporter        ClusterIP   None             <none>        9100/TCP   1m
service/prometheus-pushgateway          ClusterIP   10.100.136.143   <none>        9091/TCP   1m
service/prometheus-server               NodePort    10.100.151.245   <none>        80/30900   1m

NAME                                      DESIRED   CURRENT   READY     UP-TO-DATE   AVAILABLE   NODE SELECTOR   AGE
daemonset.apps/prometheus-node-exporter   3         3         3         3            3           <none>          1m

NAME                                            DESIRED   CURRENT   UP-TO-DATE   AVAILABLE   AGE
deployment.apps/prometheus-alertmanager         1         1         1            1           1m
deployment.apps/prometheus-kube-state-metrics   1         1         1            1           1m
deployment.apps/prometheus-pushgateway          1         1         1            1           1m
deployment.apps/prometheus-server               1         1         1            1           1m

NAME                                                       DESIRED   CURRENT   READY     AGE
replicaset.apps/prometheus-alertmanager-77cfdf85db         1         1         1         1m
replicaset.apps/prometheus-kube-state-metrics-74d5c694c7   1         1         1         1m
replicaset.apps/prometheus-pushgateway-d5fdc4f5b           1         1         1         1m
replicaset.apps/prometheus-server-6d665b876                1         1         1         1m
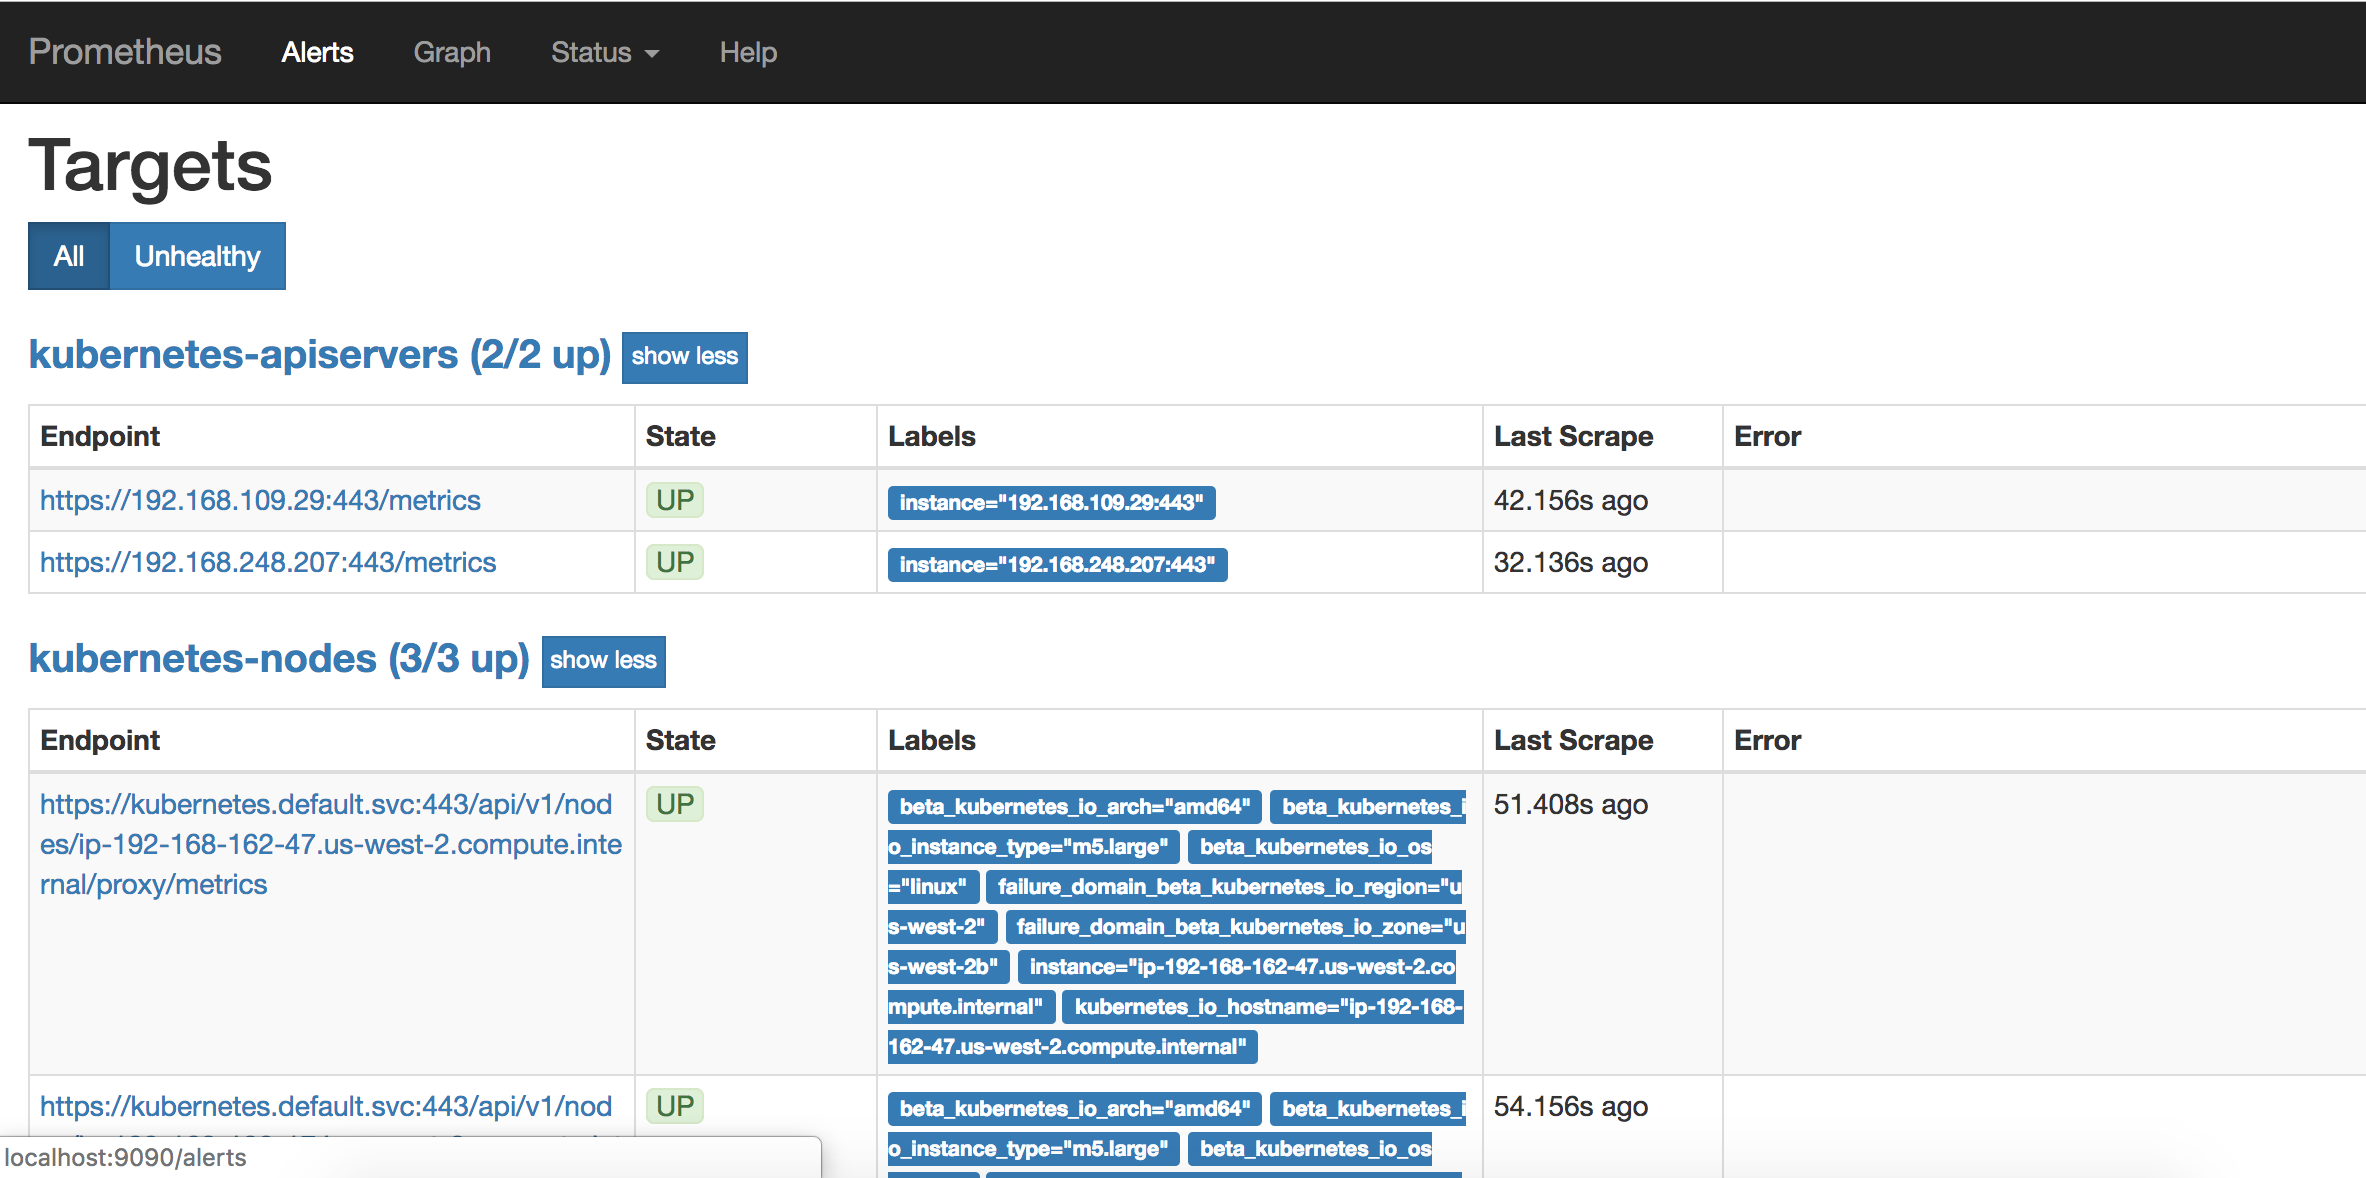
You can access Prometheus server URL by going to any one of your Worker node IP address and specify port :30900/targets (for ex, 52.12.161.128:30900/targets. Remember to open port 30900 in your Worker nodes Security Group. In the web UI, you can see all the targets and metrics being monitored by Prometheus