Monitor & Visualize
Collecting new telemetry data
Next, download a YAML file to hold configuration for the new metric and log stream that Istio will generate and collect automatically.
curl -LO https://eksworkshop.com/servicemesh/deploy.files/istio-telemetry.yaml

kubectl apply -f istio-telemetry.yaml
Make sure Prometheus and Grafana are running
kubectl -n istio-system get svc prometheus

kubectl -n istio-system get svc grafana
Setup port-forwarding for Grafana by executing the following command:
kubectl -n istio-system port-forward $(kubectl -n istio-system get pod -l app=grafana -o jsonpath='{.items[0].metadata.name}') 8080:3000 &
Open the Istio Dashboard via the Grafana UI
- In your Cloud9 environment, click Preview / Preview Running Application
- Scroll to the end of the URL and append:
/dashboard/db/istio-mesh-dashboard
Open a new terminal tab and enter to send a traffic to the mesh
export SMHOST=$(kubectl get service istio-ingressgateway -o jsonpath='{.status.loadBalancer.ingress[0].hostname} ' -n istio-system)

SMHOST="$(echo -e "${SMHOST}" | tr -d '[:space:]')"

while true; do curl -o /dev/null -s "${SMHOST}/productpage"; done
You will see that the traffic is evenly spread between reviews:v1 and reviews:v3
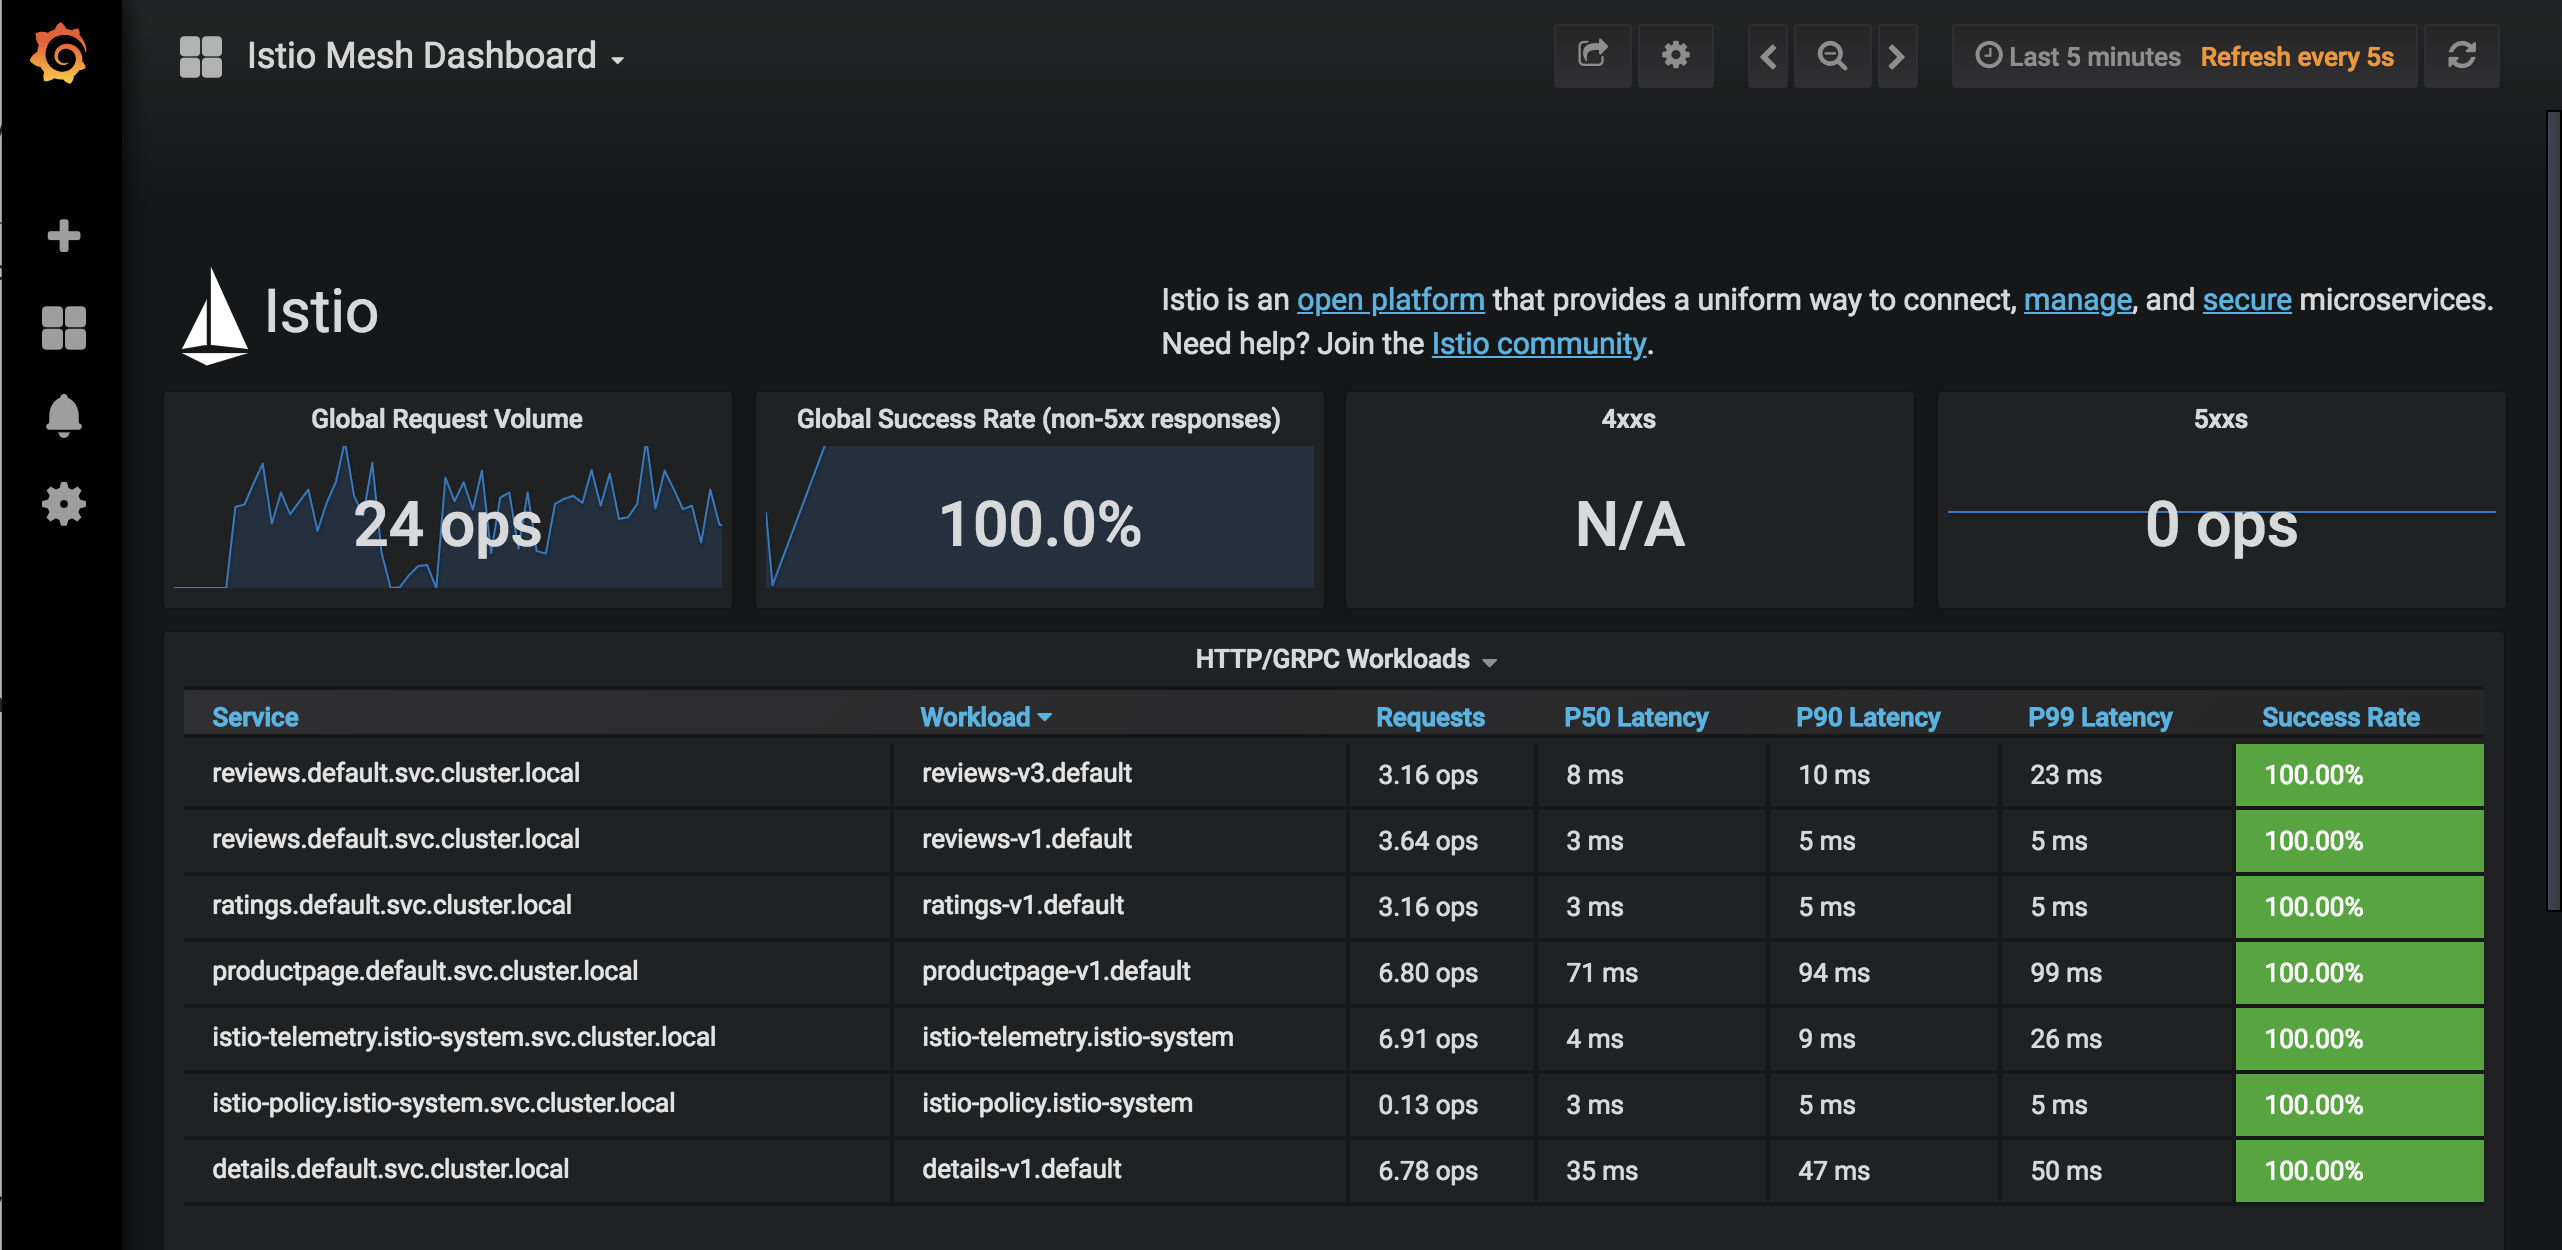
We encourage you to explore other Istio dashboards that are available by clicking the Istio Mesh Dashboard menu on top left of the page, and selecting a different dashboard.